
 Japanese
| |
| ¶Top Page | |
The National Research Institute for Earth Science and Disaster Resilience (NIED) has developed software that shows the NIED standard three-dimensional velocity structure beneath Japanese Islands that was determined using data from the NIED high sensitivity seismograph network (Hi-net), NIED Seafloor Observation Network for Earthquakes and Tsunamis along the Japan Trench (S-net), and other seismic networks operated by Japan Meteorological Agency, national universities, and other national institutes and so on in addition to the air gun experiment data.
Among other things, this model shows the Pacific and Philippine Sea Plates subducting beneath the Japanese Islands and NIED S-net data provide us the shallow structure beneath the Pacific Ocean as well as the shallow crustal structure beneath the Sea of Japan owing to the air gun data.
This software allows the user to produce an image of the velocity structure at any given location.
Earthquake hypocenters, focal mechanisms, and P- and T-axis can be overlain given an input file.
This software runs on Windows 10, Macintosh.  Download
[Download size 37MB -- 2023/06/05 16:00 updated]
This velocity model was published in Earth Planets and Space and is open to public. If you use the figures with this software, refer to the following paper: Matsubara, M., T. Ishiyama, T. No, K. Uehira, M. Mochizuki, T. Kanazawa, N. Takahashi, and S. Kamiya, Seismic velocity structure along the Sea of Japan with large events derived from seismic tomography for whole Japanese Islands including reflection survey data and NIED MOWLAS Hi-net and S-net data, Earth, Planets and Space (2022) 74:171, https://doi.org/10.1186/s40623-022-01724-0 This velocity model is also open to public (only in Japanese). Notice: NIED has no responsibility whatsoever for any direct or indirect damage or loss caused by the using this software. The Windows version of this software has been confirmed to work with Java version 8. It does not work with Java version 9 and above. | |
|
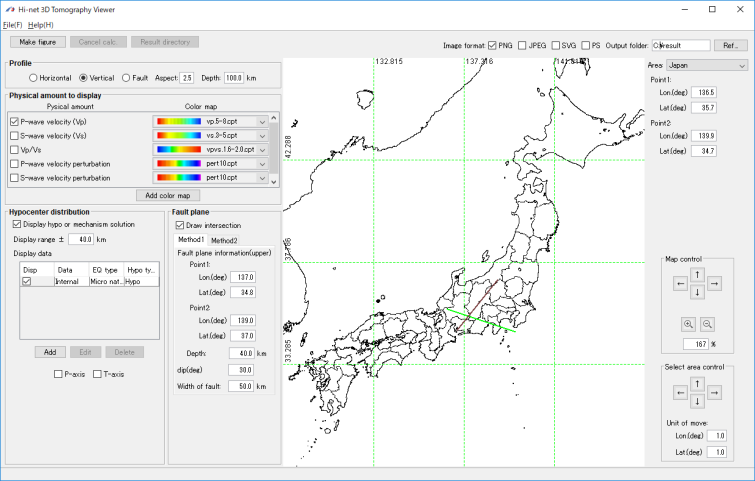
▌Figure 1 Default input image. | |
| |
| Go to the top of this page | |
|
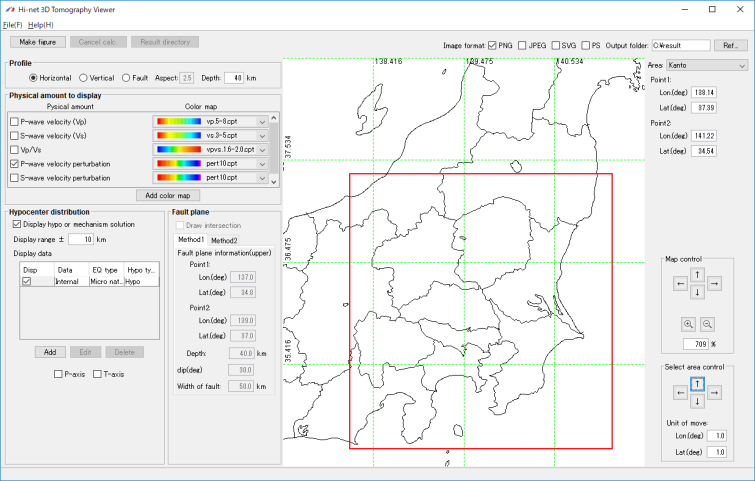
▌Figure 2 Input image for depth slice at 40 km of P-wave velocity (Vp) perturbation beneath Kanto region. | |
| |
|
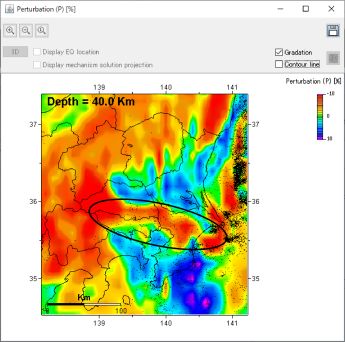
▌Figure 3 Depth slice at 40 km of Vp perturbation beneath Kanto region. E-W low-velocity (low-V) zone exists. | |
| |
|
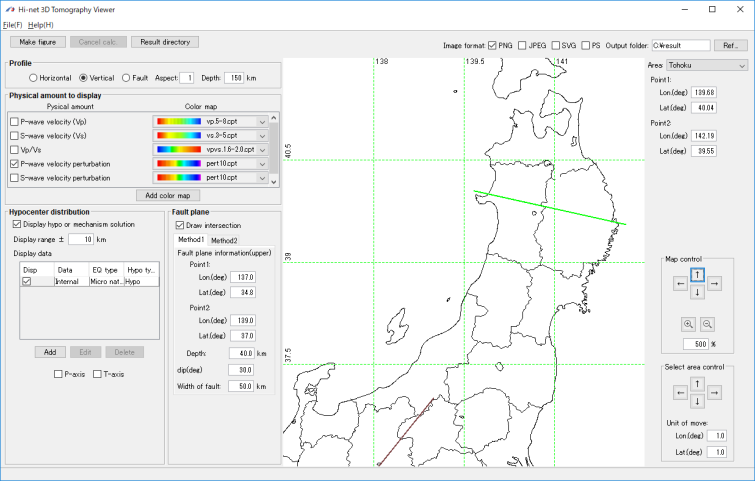
▌Figure 4 Input image for vertical cross section of Vp perturbation beneath northeastern Japan. | |
| |
|
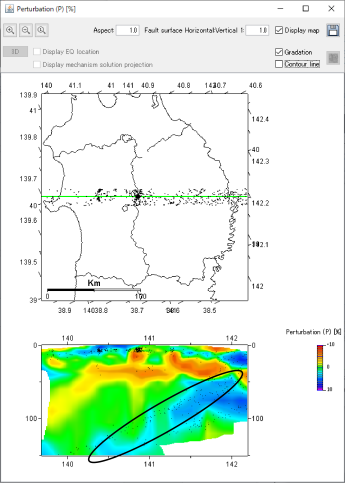
▌Figure 5 Vertical cross section of Vp perturbation beneath northeastern Japan. High-velocity (high-V) subducting Pacific plate is imaged. | |
| |
| Go to the top of this page | |
|
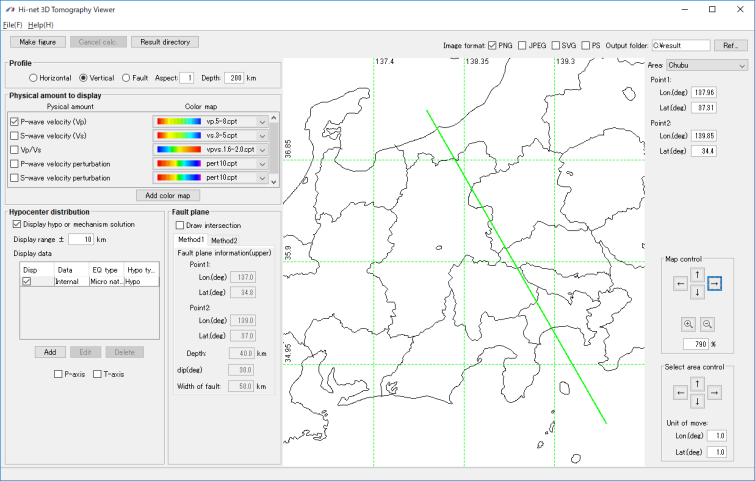
▌Figure 6 Input image for vertical cross section of Vp perturbation beneath central Japan. | |
| |
|
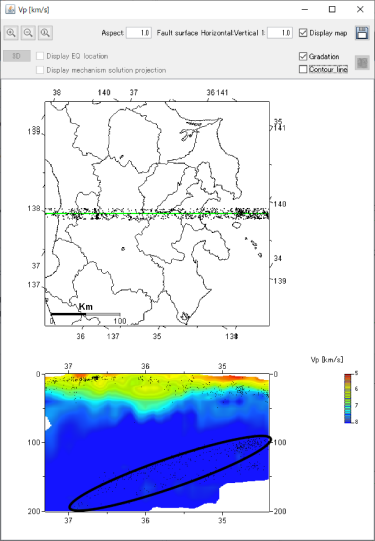
▌Figure 7 Vertical cross section of Vp perturbation beneath central Japan. High-V subducting Philippine Sea plate is imaged. | |
| |
|
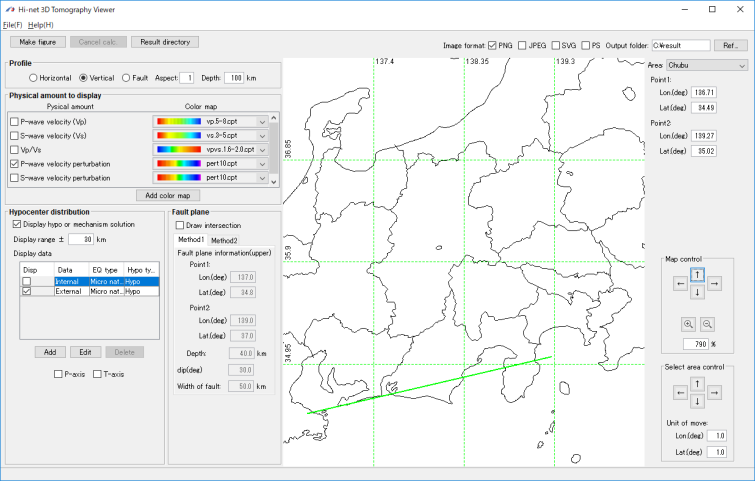
▌Figure 8 Input image for overlaying users' hypocenter catalog. | |
| |
|
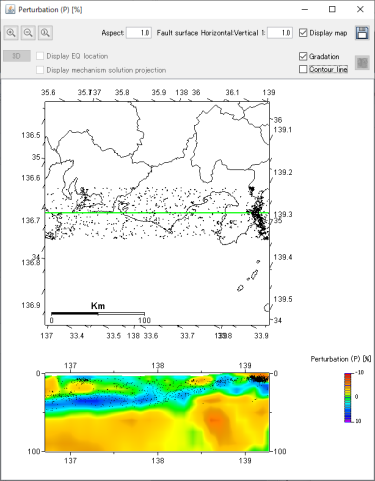
▌Figure 9 Vertical cross section of Vp perturbation with hypocenters (gray dots) beneath central Japan. | |
| |
| Go to the top of this page | |
|
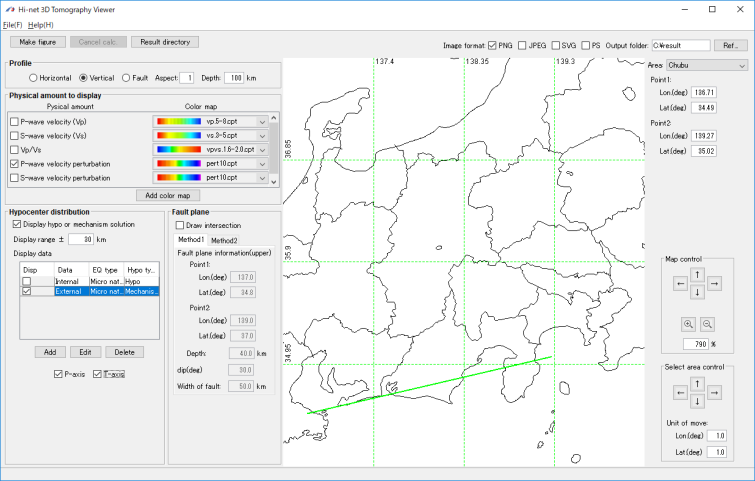
▌Figure 10 Input image for showing focal mechanisms, P- and T-axes. | |
| |
|
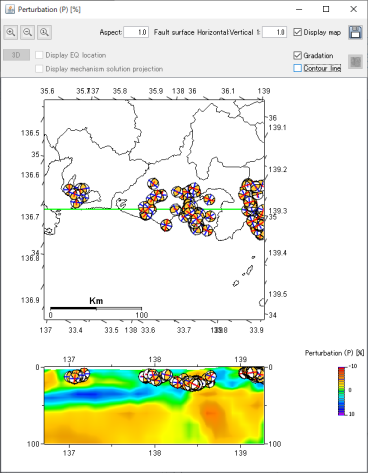
▌Figure 11 Vertical cross section of Vp perturbation with focal mechanisms, P- and T-axes beneath central Japan. Blue and red lines denote P- and T- axes, respectively. | |
| |
|
▌Figure 12 Input image for showing crossing line to fault plane. | |

| |
|
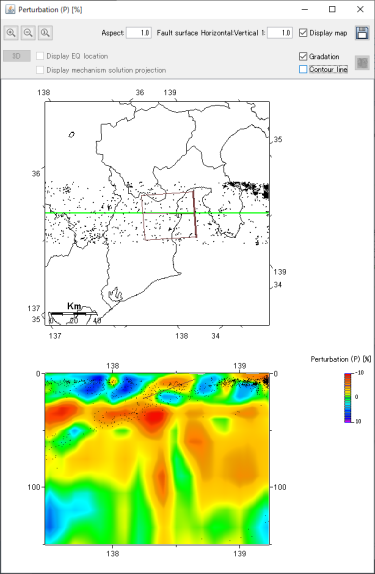
▌Figure 13 Vertical cross section of Vp perturbation with crossing line to fault plane. Brown line in the lower panel is the crossing line to the fault plane. Thick brown line in the top panel show the top of the fault the users inputted. Brown rectangle is the map view of the fault plane. | |
| |
| Go to the top of this page | |
|
You can change the size and color of hypocenter and focal mechanism as follows:
| |
|
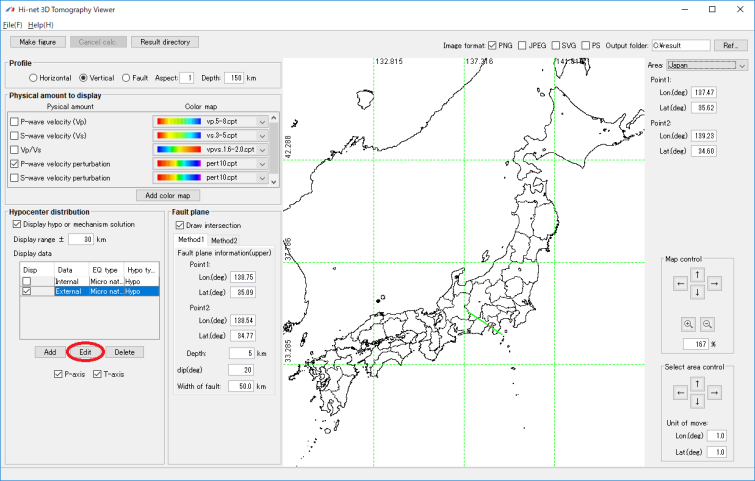
▌Figure 14 Butten to open figure 15 for inputting hypocenter or focal mechanism data file. | |
| |
|
▌Figure 15 (a) Input the hypocenter or focal mechanism file and butten to open image (b). (b) Setting for color and size of hypocenter, focal mechamism and P- and T- axes. | |
(a)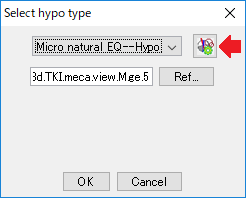
|
(b)
|
|
Go to the top of this page | |